Turn CSV data into beautiful charts
instantly
Paste your data or upload a CSV. Your chart renders immediately — pick a type, adjust columns, export as PNG.
- Auto-detects columns from any CSV
- Line, bar & scatter charts
- Export as high-resolution PNG
datatochart.app
Chart tool works best on a larger screen
Open this page on a tablet or desktop for the full chart-building experience. Scroll down to see example charts.
Input data
Format
Color theme
Paste or import a CSV to see your chart
Built for speed not complexity
Data-first workflow
Paste CSV or upload files. Built around real spreadsheet workflows — no import wizards, no reformatting.
Smart chart generation
Columns are detected automatically. Chart type is suggested based on your data structure.
Beautiful by default
Clean visuals, strong defaults, export-ready charts. No tweaking colors or fonts required.
Paste data.
Get a chart. Done.
DataToChart removes every step between your data and a clean chart. Paste a CSV, pick a chart type, and your visualization renders immediately — no account, no configuration, no waiting.
10 seconds
from data to chart
3 steps
simple workflow
Ø
setup required
Who is it for ?
Consultants & analysts
Client-ready charts from raw data exports — no Excel chart wizards.
Students & researchers
Clean visuals for papers, presentations, and lab reports.
Marketing & business teams
KPIs and growth charts for decks and reports in seconds.
3 steps from data to chart
Paste or upload data
Drop a CSV or paste from your spreadsheet. Headers detected automatically.
Choose chart type & adust parameters
Line, bar, or scatter — pick the visualization that fits your data. Pick X / Y columns. Rename labels if needed.
Visualize & export
Get the rendered chart & download a high-resolution PNG.
Example charts
See more →Real examples from simple CSV and spreadsheet data
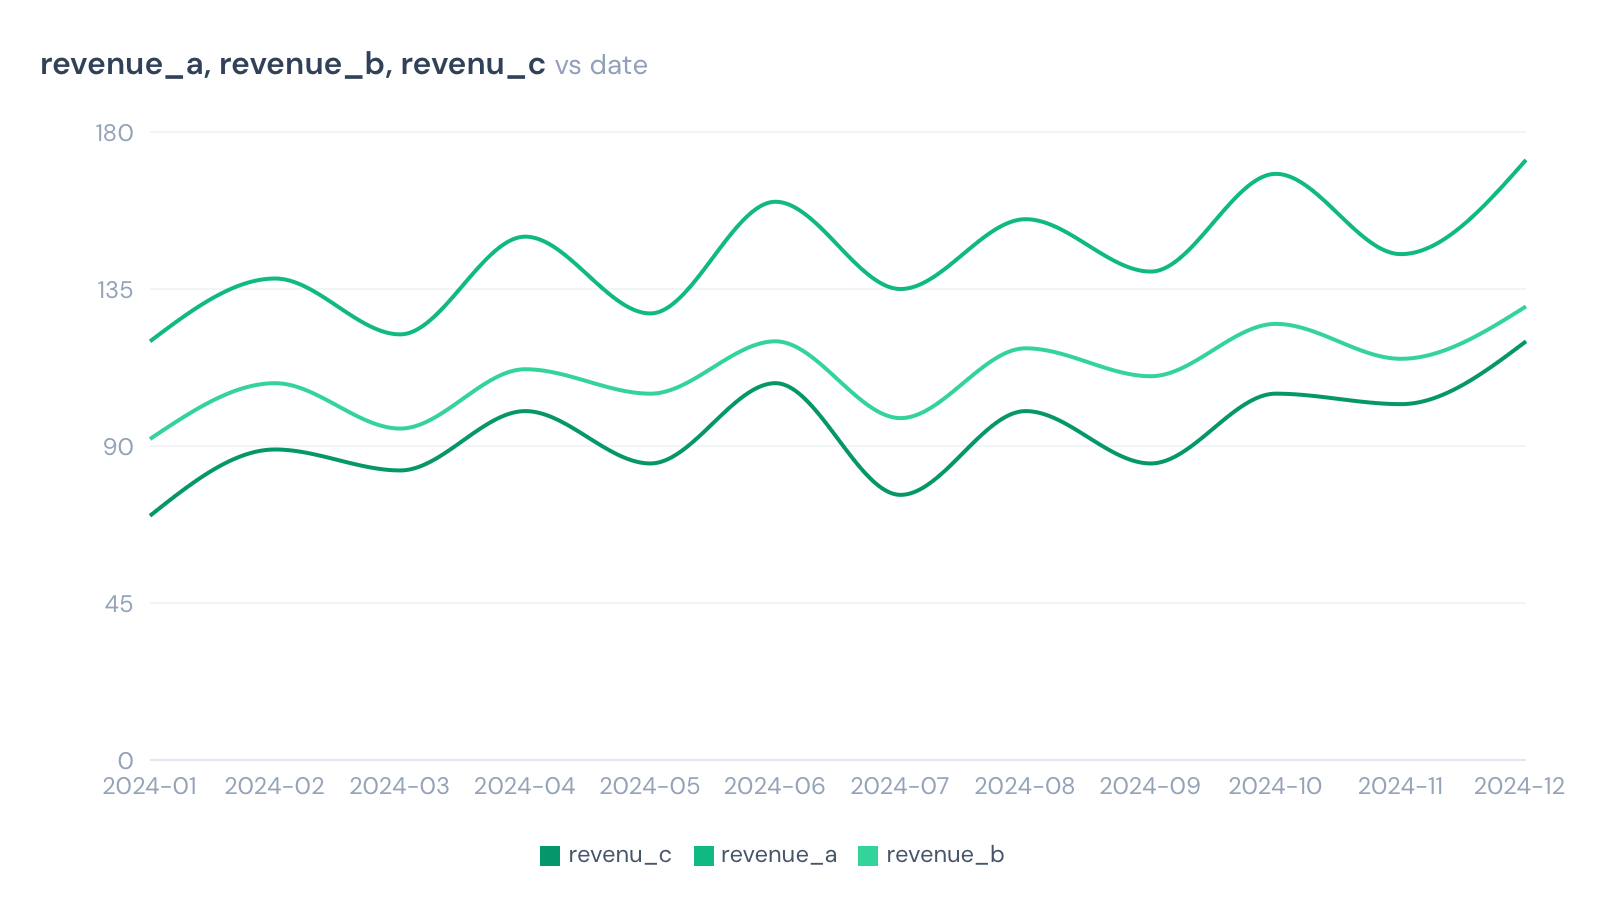
Line chart (3 columns)
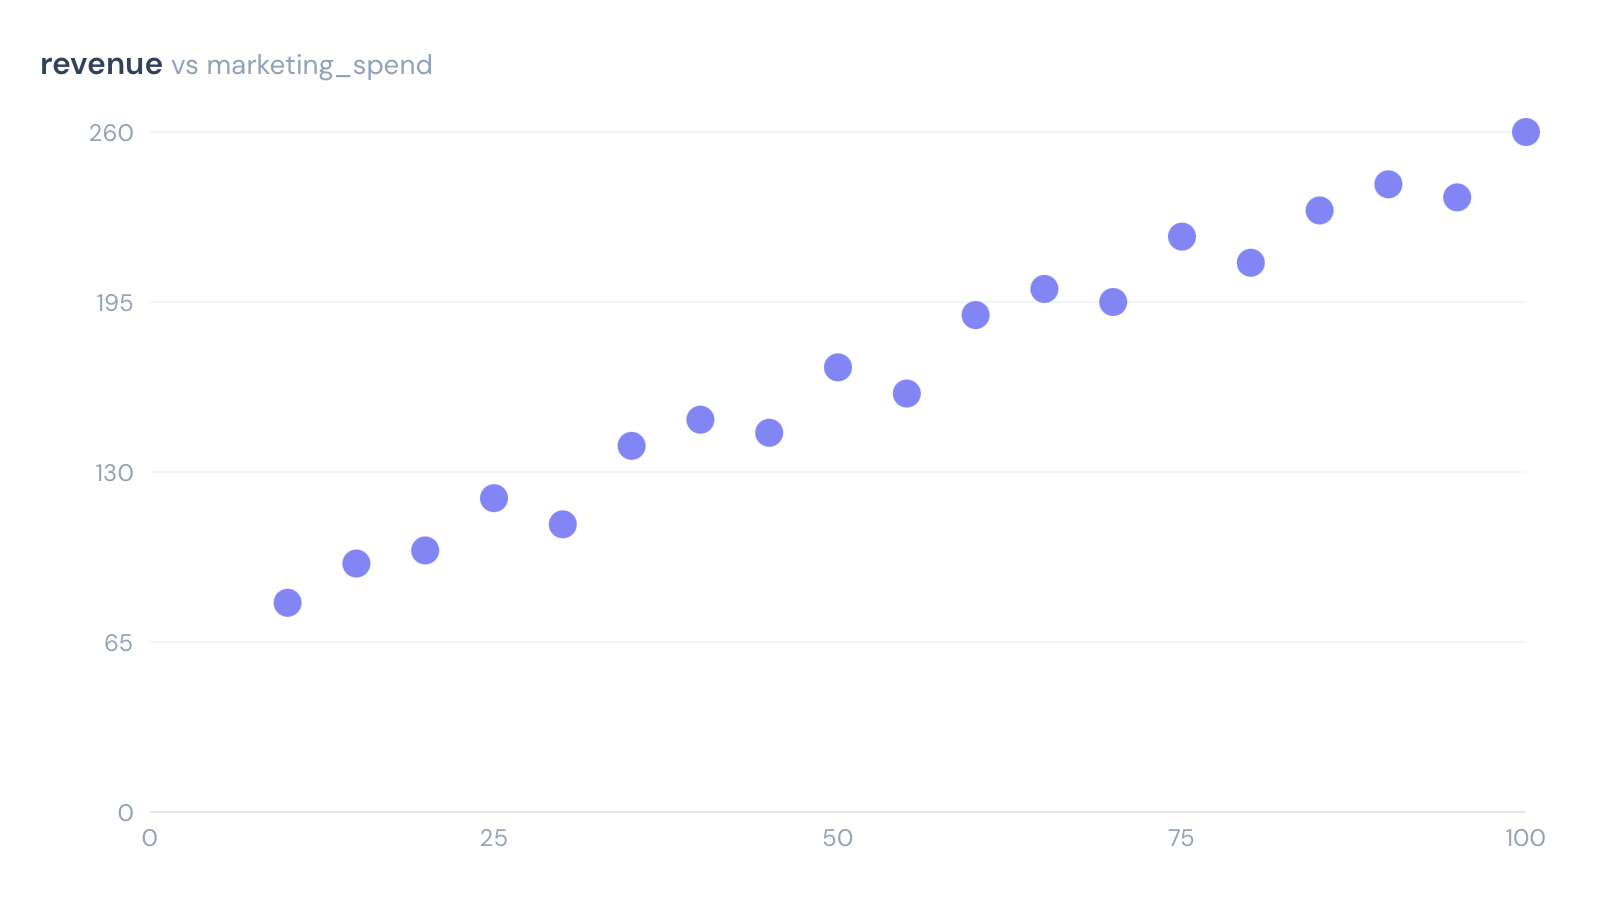
Scatter chart
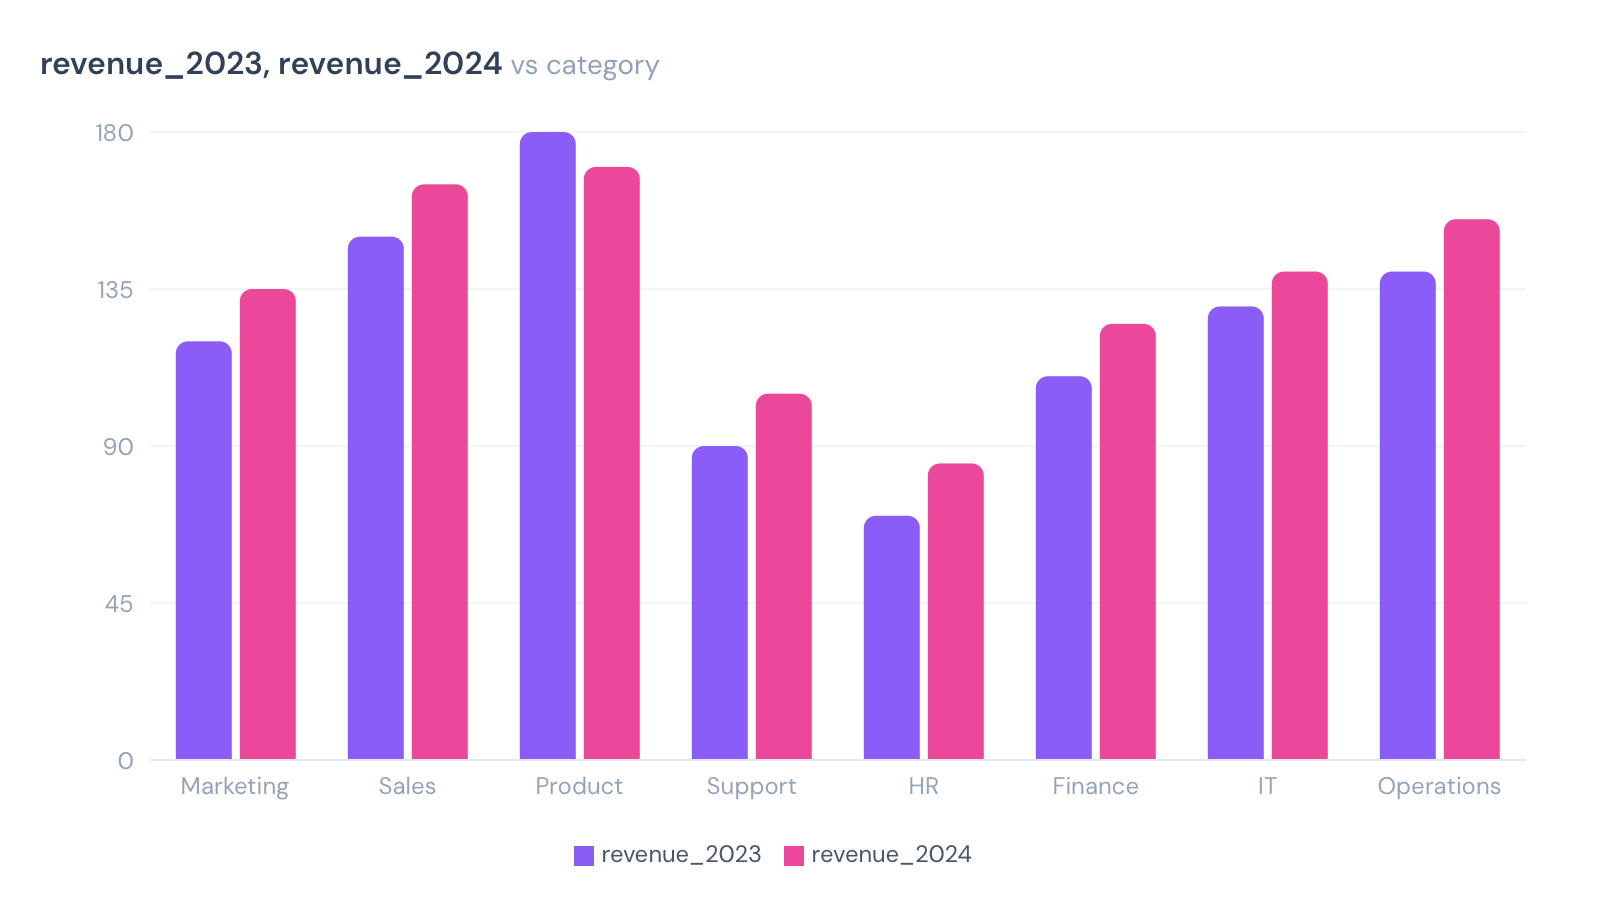
Bar chart categories (8 categories)
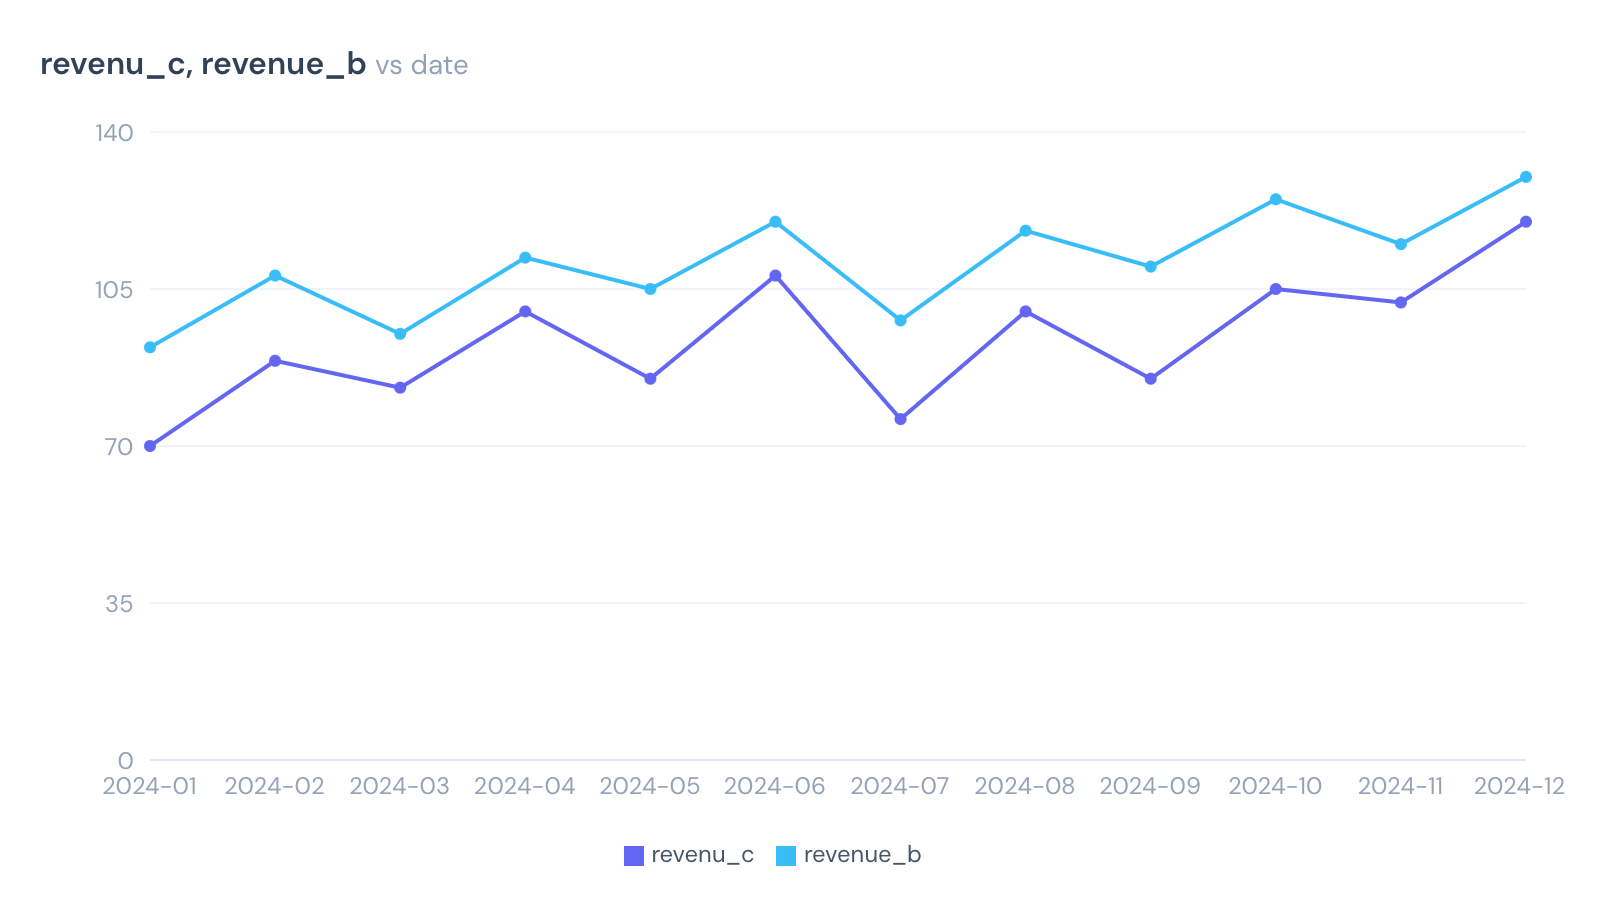
Straight line chart (2 columns)
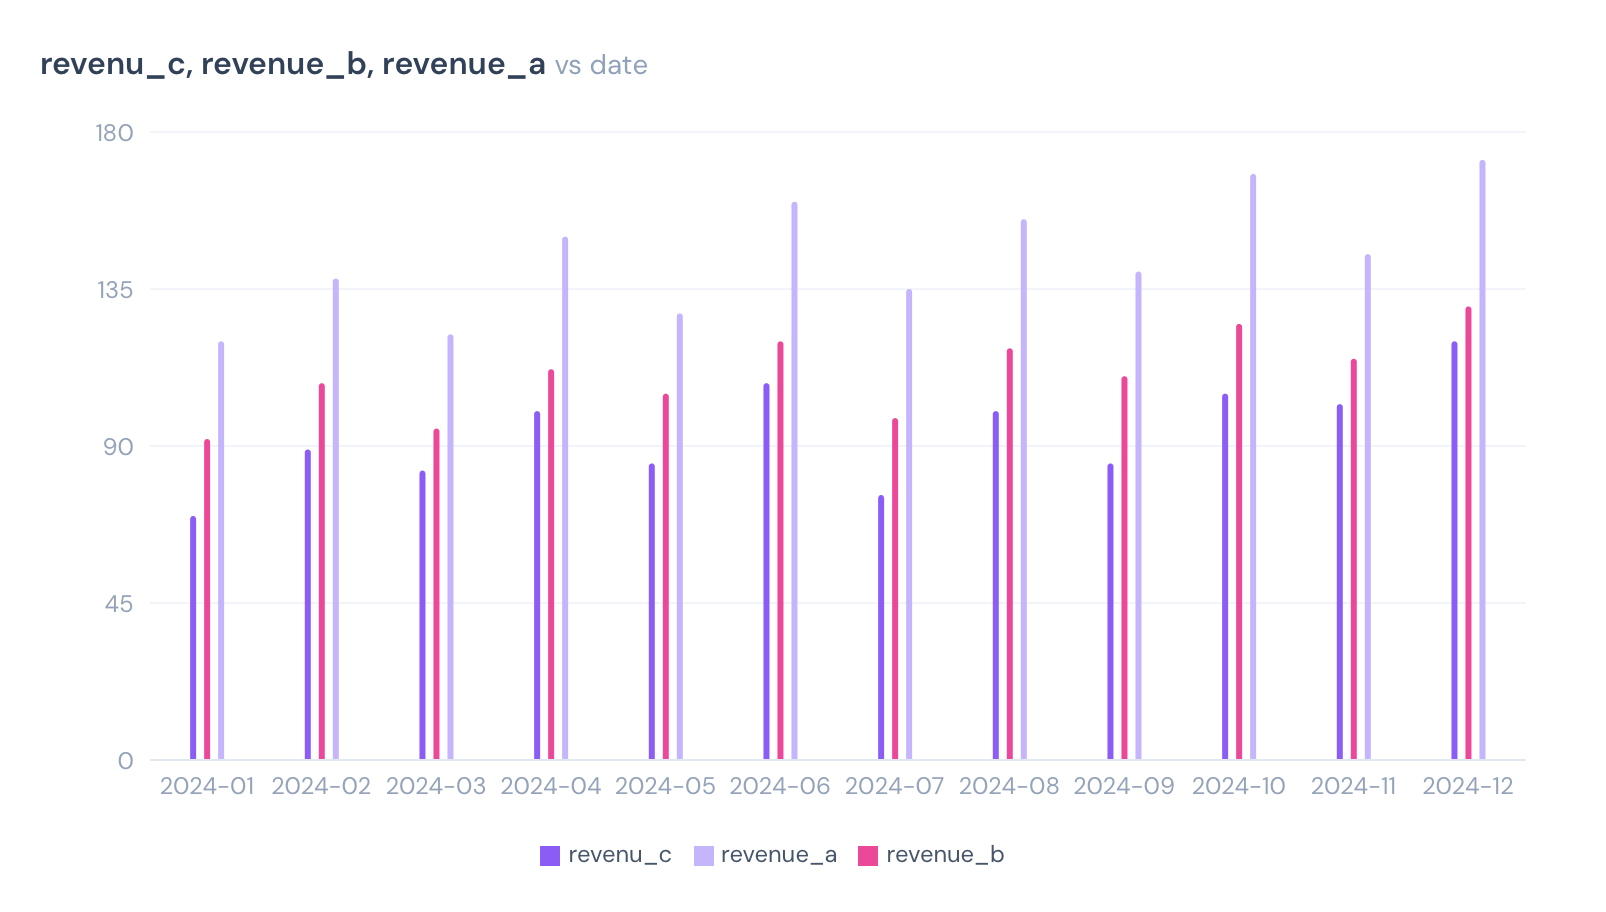
Bar chart (3 columns)
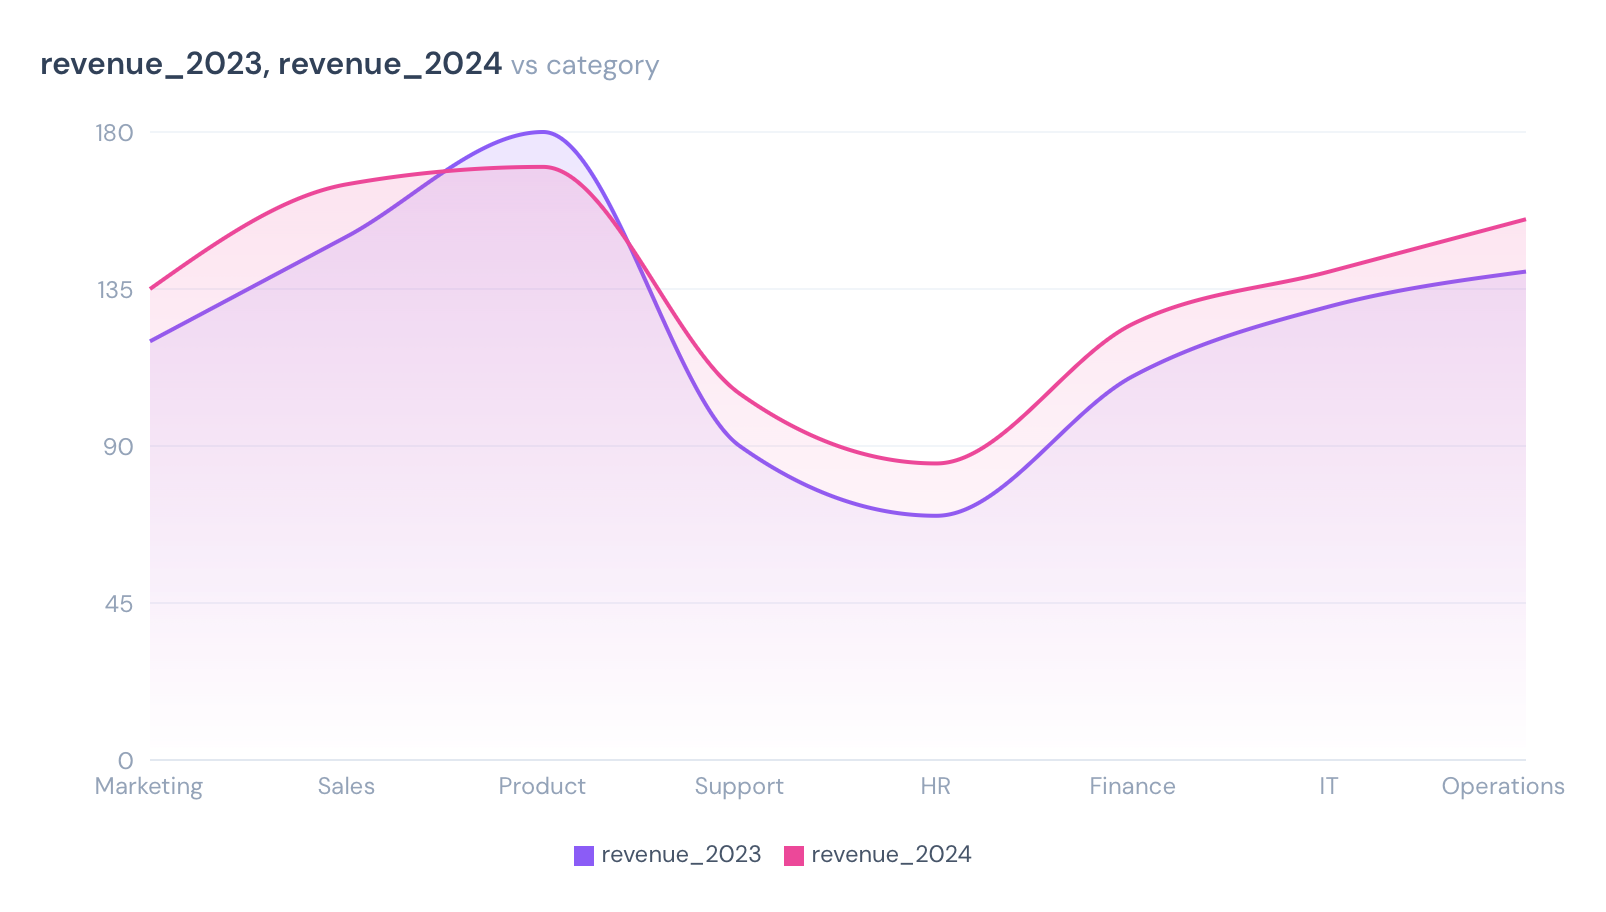
Gradient line chart (2 columns)
FAQ
Common questions
What data formats are supported?+
CSV files (.csv) and raw CSV text pasted directly. Export from Excel, Google Sheets, or any tool that outputs comma-separated values.
What chart types are available?+
Line charts, bar charts, and scatter plots — covering the vast majority of data communication needs.
What can I export?+
By now, you can only export in PNG print-quality output. We are currently working on other format for exports.
Do I need any technical skills?+
No. The tool is entirely point-and-click. If you can use a spreadsheet, you can use DataToChart.
Can I use charts in slides and reports?+
Absolutely. Charts export with clean defaults at high resolution — ready to paste into PowerPoint, Keynote, or Google Slides.